
Plan 4-3-23: The First Move of the Uptrend is Made - Dialing in a Plan Based on What Type of Trader You Are

The focus of this stack is efficient trading. A simple daily letter outlining short term bull and bear scenarios coupled with a longer term bias displayed visually on easy to read charts. Price action examples are explained and annotated when they’re relevant to the current day. The aim is to sharpen the reader’s daily market outlook.
Levels given take into account channels, volume profile points of control, key zones acting as either magnets or potential squeeze targets and levels of overhead supply/demand. This information is then distilled down into actionable support/resistance levels and an intraday plan. These levels will change each day as price reacts to the various highlighted zones discussed. Conversely there are no fundamental biases associated with these reads.
@efficientenzyme on Twitter or Substack message for questions regarding daily plan
/ES Roadmap
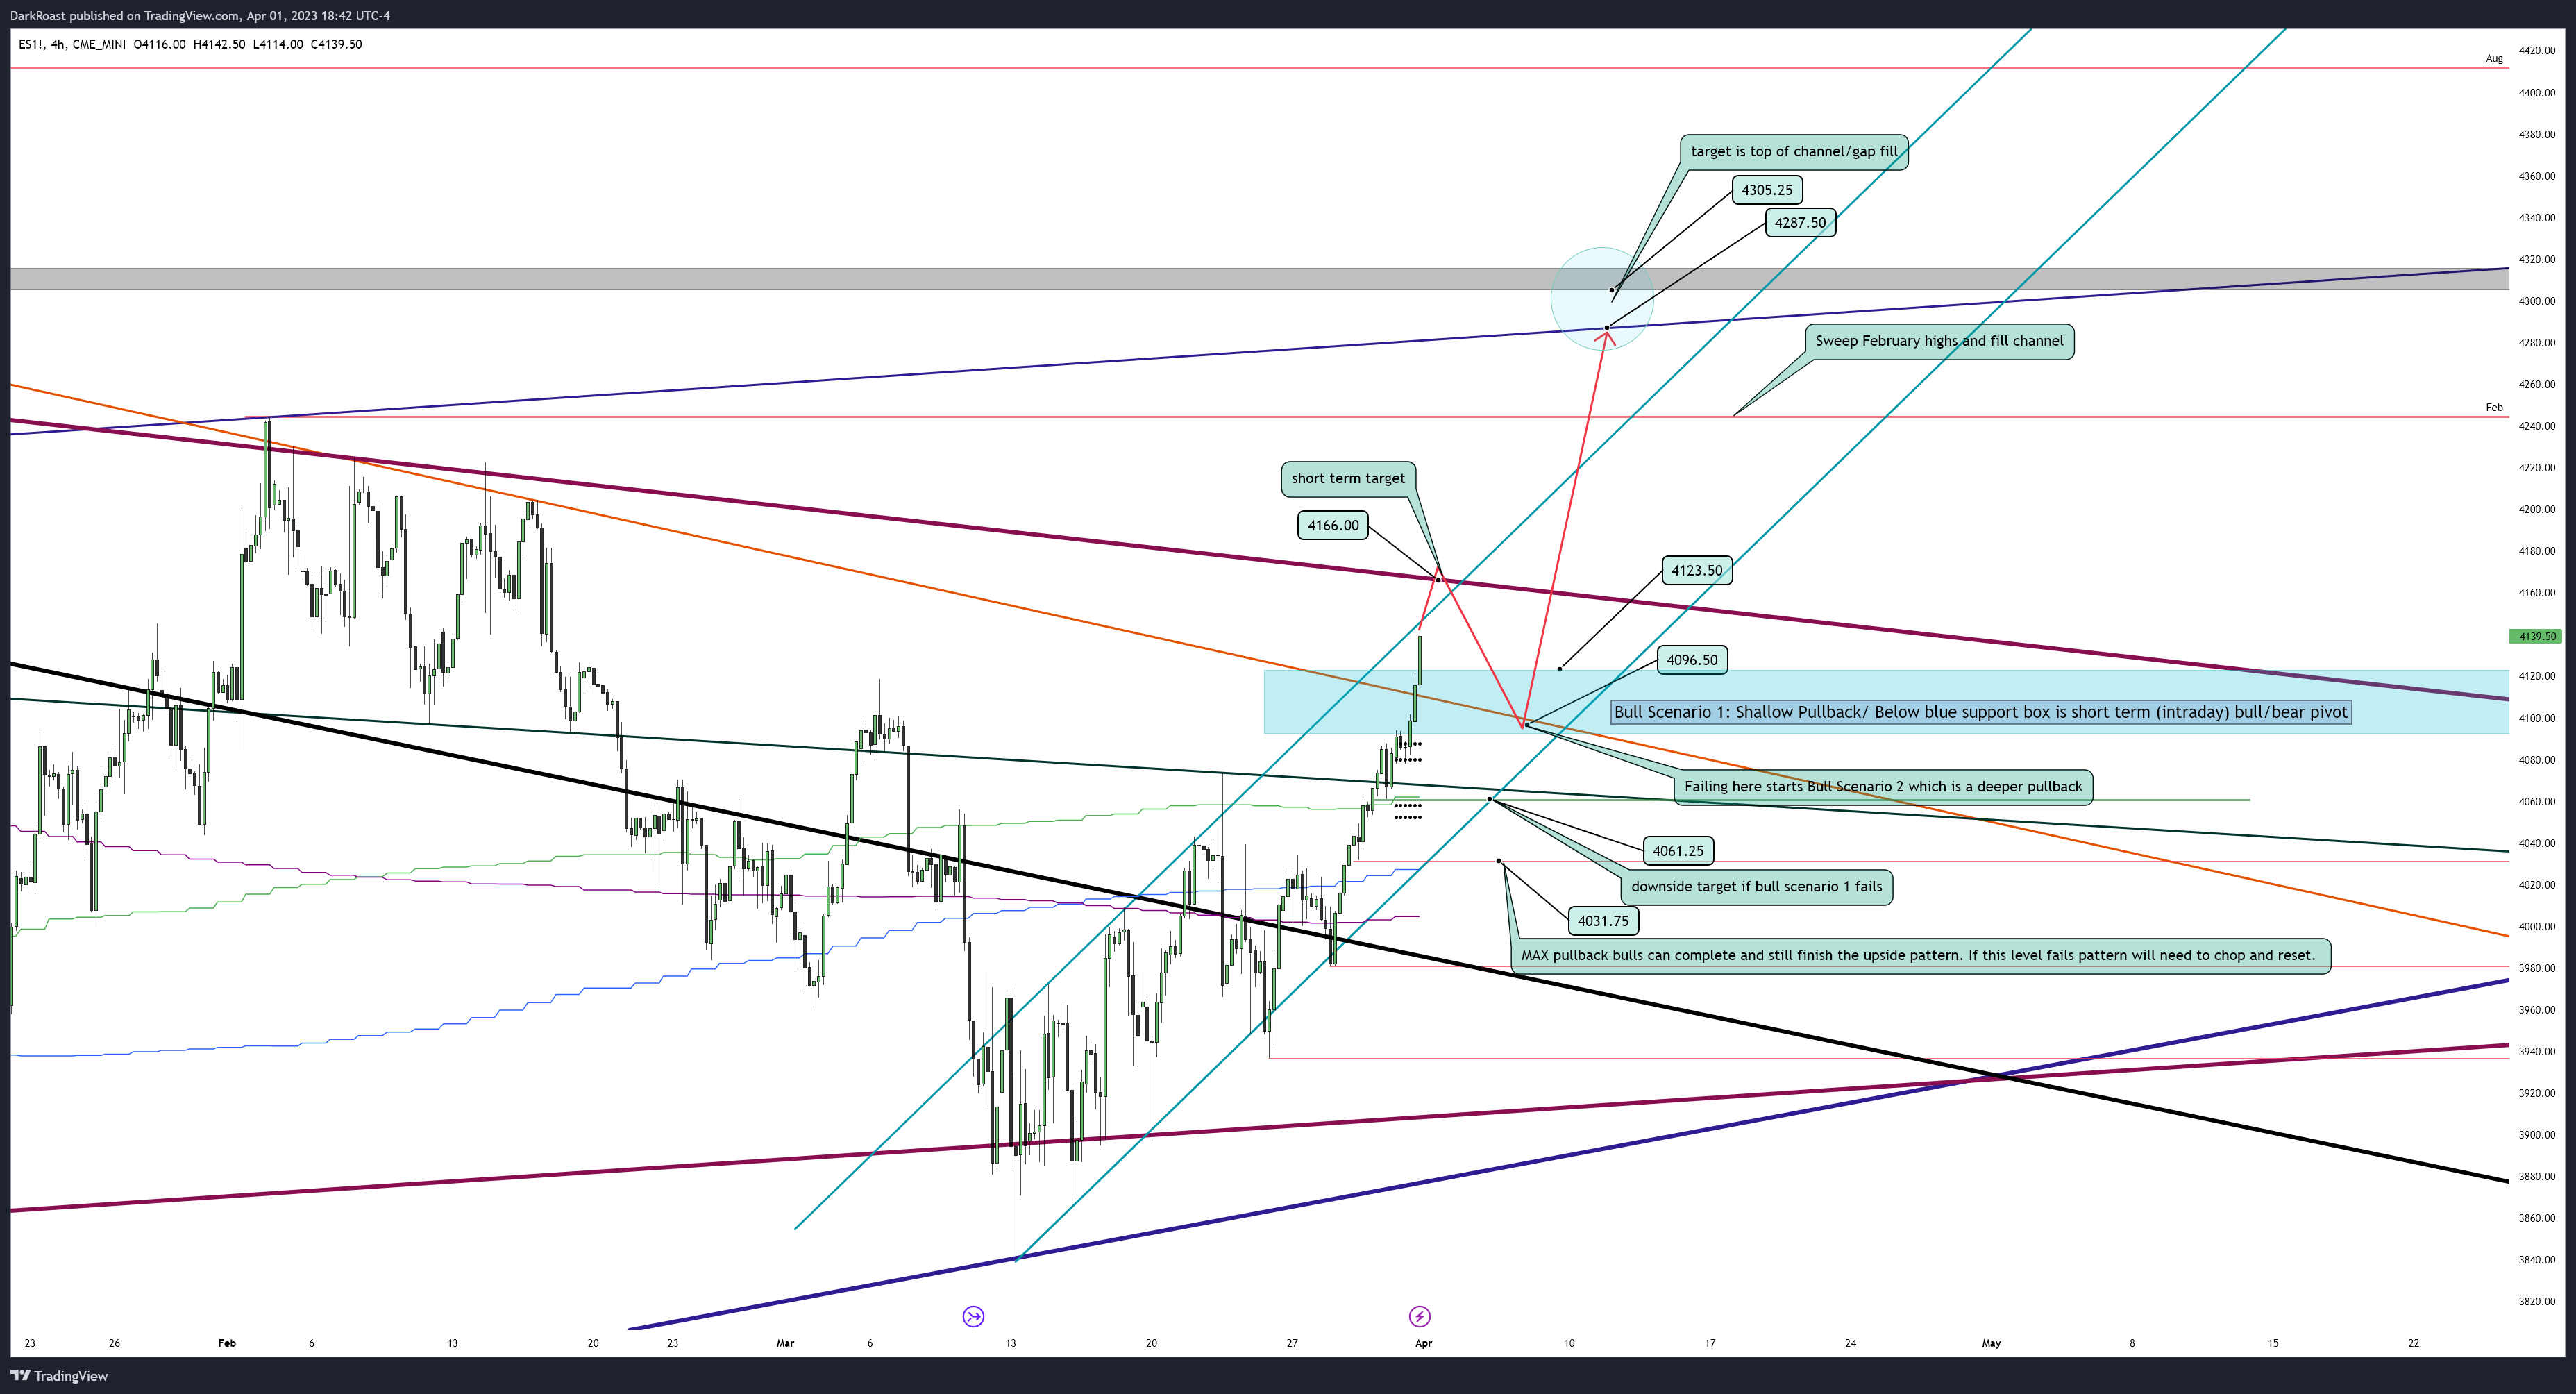
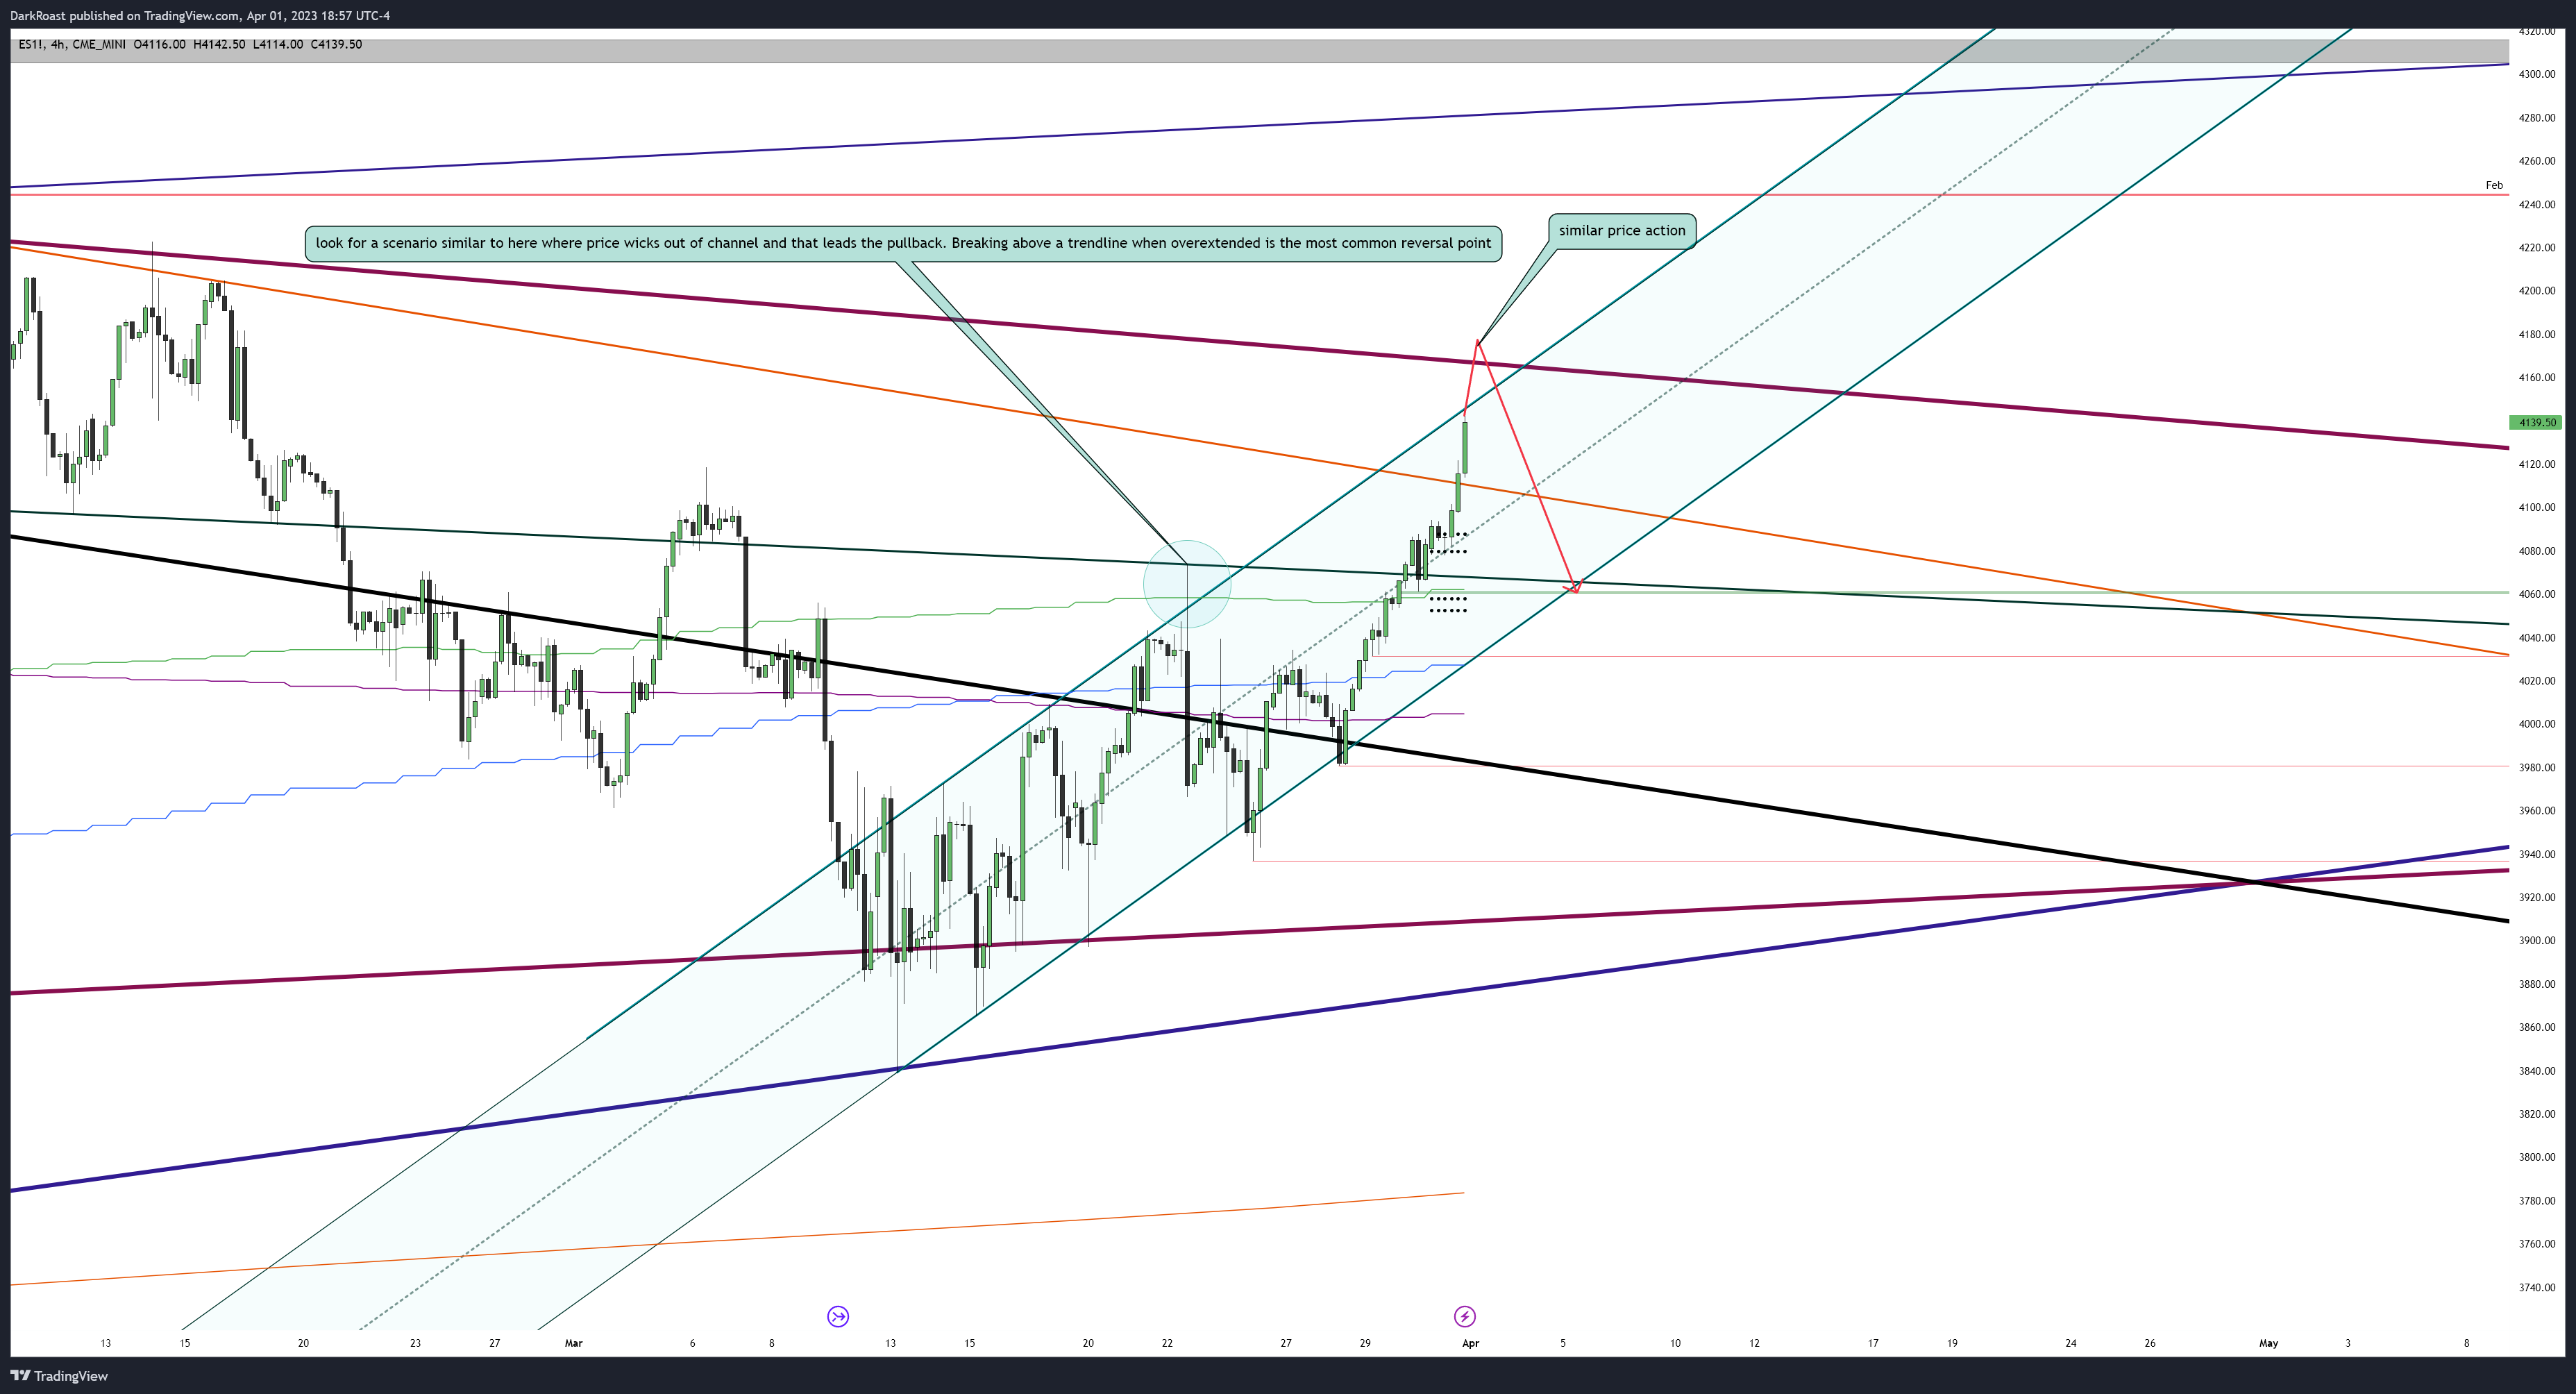
Price keeps knocking down targets to the upside and is highly likely to continue. There are two high probability scenarios that can play out which are labeled bull scenario 1 and bull scenario 2. The short of it is either price pops right at open to hit the short term target and completes a shallow pullback or momentum fades and price requires some deeper pullbacks to hit upside. Bull Scenario 1 is the more likely of the two. What is important is that by the time the rally concludes the February highs are swept at 4245+.
Tomorrow’s Plan:
Bull Scenario(1): Continuation direct. Look for a small consolidation with a pullback no deeper than 4120s. This targets 4166 on the upside. Any pullback here that holds a higher low of 4095 Continues to 4287 to 4305 for next leg up. Keep in mind this is not necessarily intraday but when consolidation concludes which is unpredictable. If price continues to squeeze once hitting the first upside target (4166) without a pullback there is no predicting how far it’ll go before the pullback occurs so trailing a stop is the best way to go.
Bull Scenario(2): Lose 4096 zone. Closing below here back tests at least 4061. This is still bullish although it is cleaner price action to follow the first scenario as this one may incorporate additional chop. This has the same upside targets when consolidation breaks but will require the reclaim of 4090s to start the scenario.
Bear Scenario: Lose 4031. This is still a short term bear case at the upside is still possible. This is the least preferred scenario because it falls back into chop directly. There’s no high time frame bear scenario possible until price closes a daily candle below 4000.
Resistance: 4147, 4163-66, 4180, 4196, 4205, 4218-25
Support: 4122, 4114, 4090-95 (short term pivot), 4076, 4067, 4061, 4053, 4045, 4031 (bulls can’t lose this in the depth of the pullback and back tests 4000 zone upon failure)
Summary: Ideally bull scenario 1 plays out. This will be a clean easy setup where price pops and has an orderly pullback. The next leg will then take out the current highs and sweep February highs/close the gap around 4300 zone. The risk to this upside is failing to hold 4030s in the depth of the pullback which resets the pattern. If this level is held as a higher low through all consolidation then sweeping the February highs is back tested at about 78% for this particular three drive setup.
What type of trader are you?
This letter discusses fractals quite a bit but lets dive a bit deeper into how that can help positioning. The idea is that every pattern repeats on every time frame and with a realistic sense of potential drawdown and the time a play takes to complete any candle size can be traded off of. This means whether you’re trying to leverage 500$ a point on ES one minute candles or swing chunks of your 401k in the market there is an opportunity.
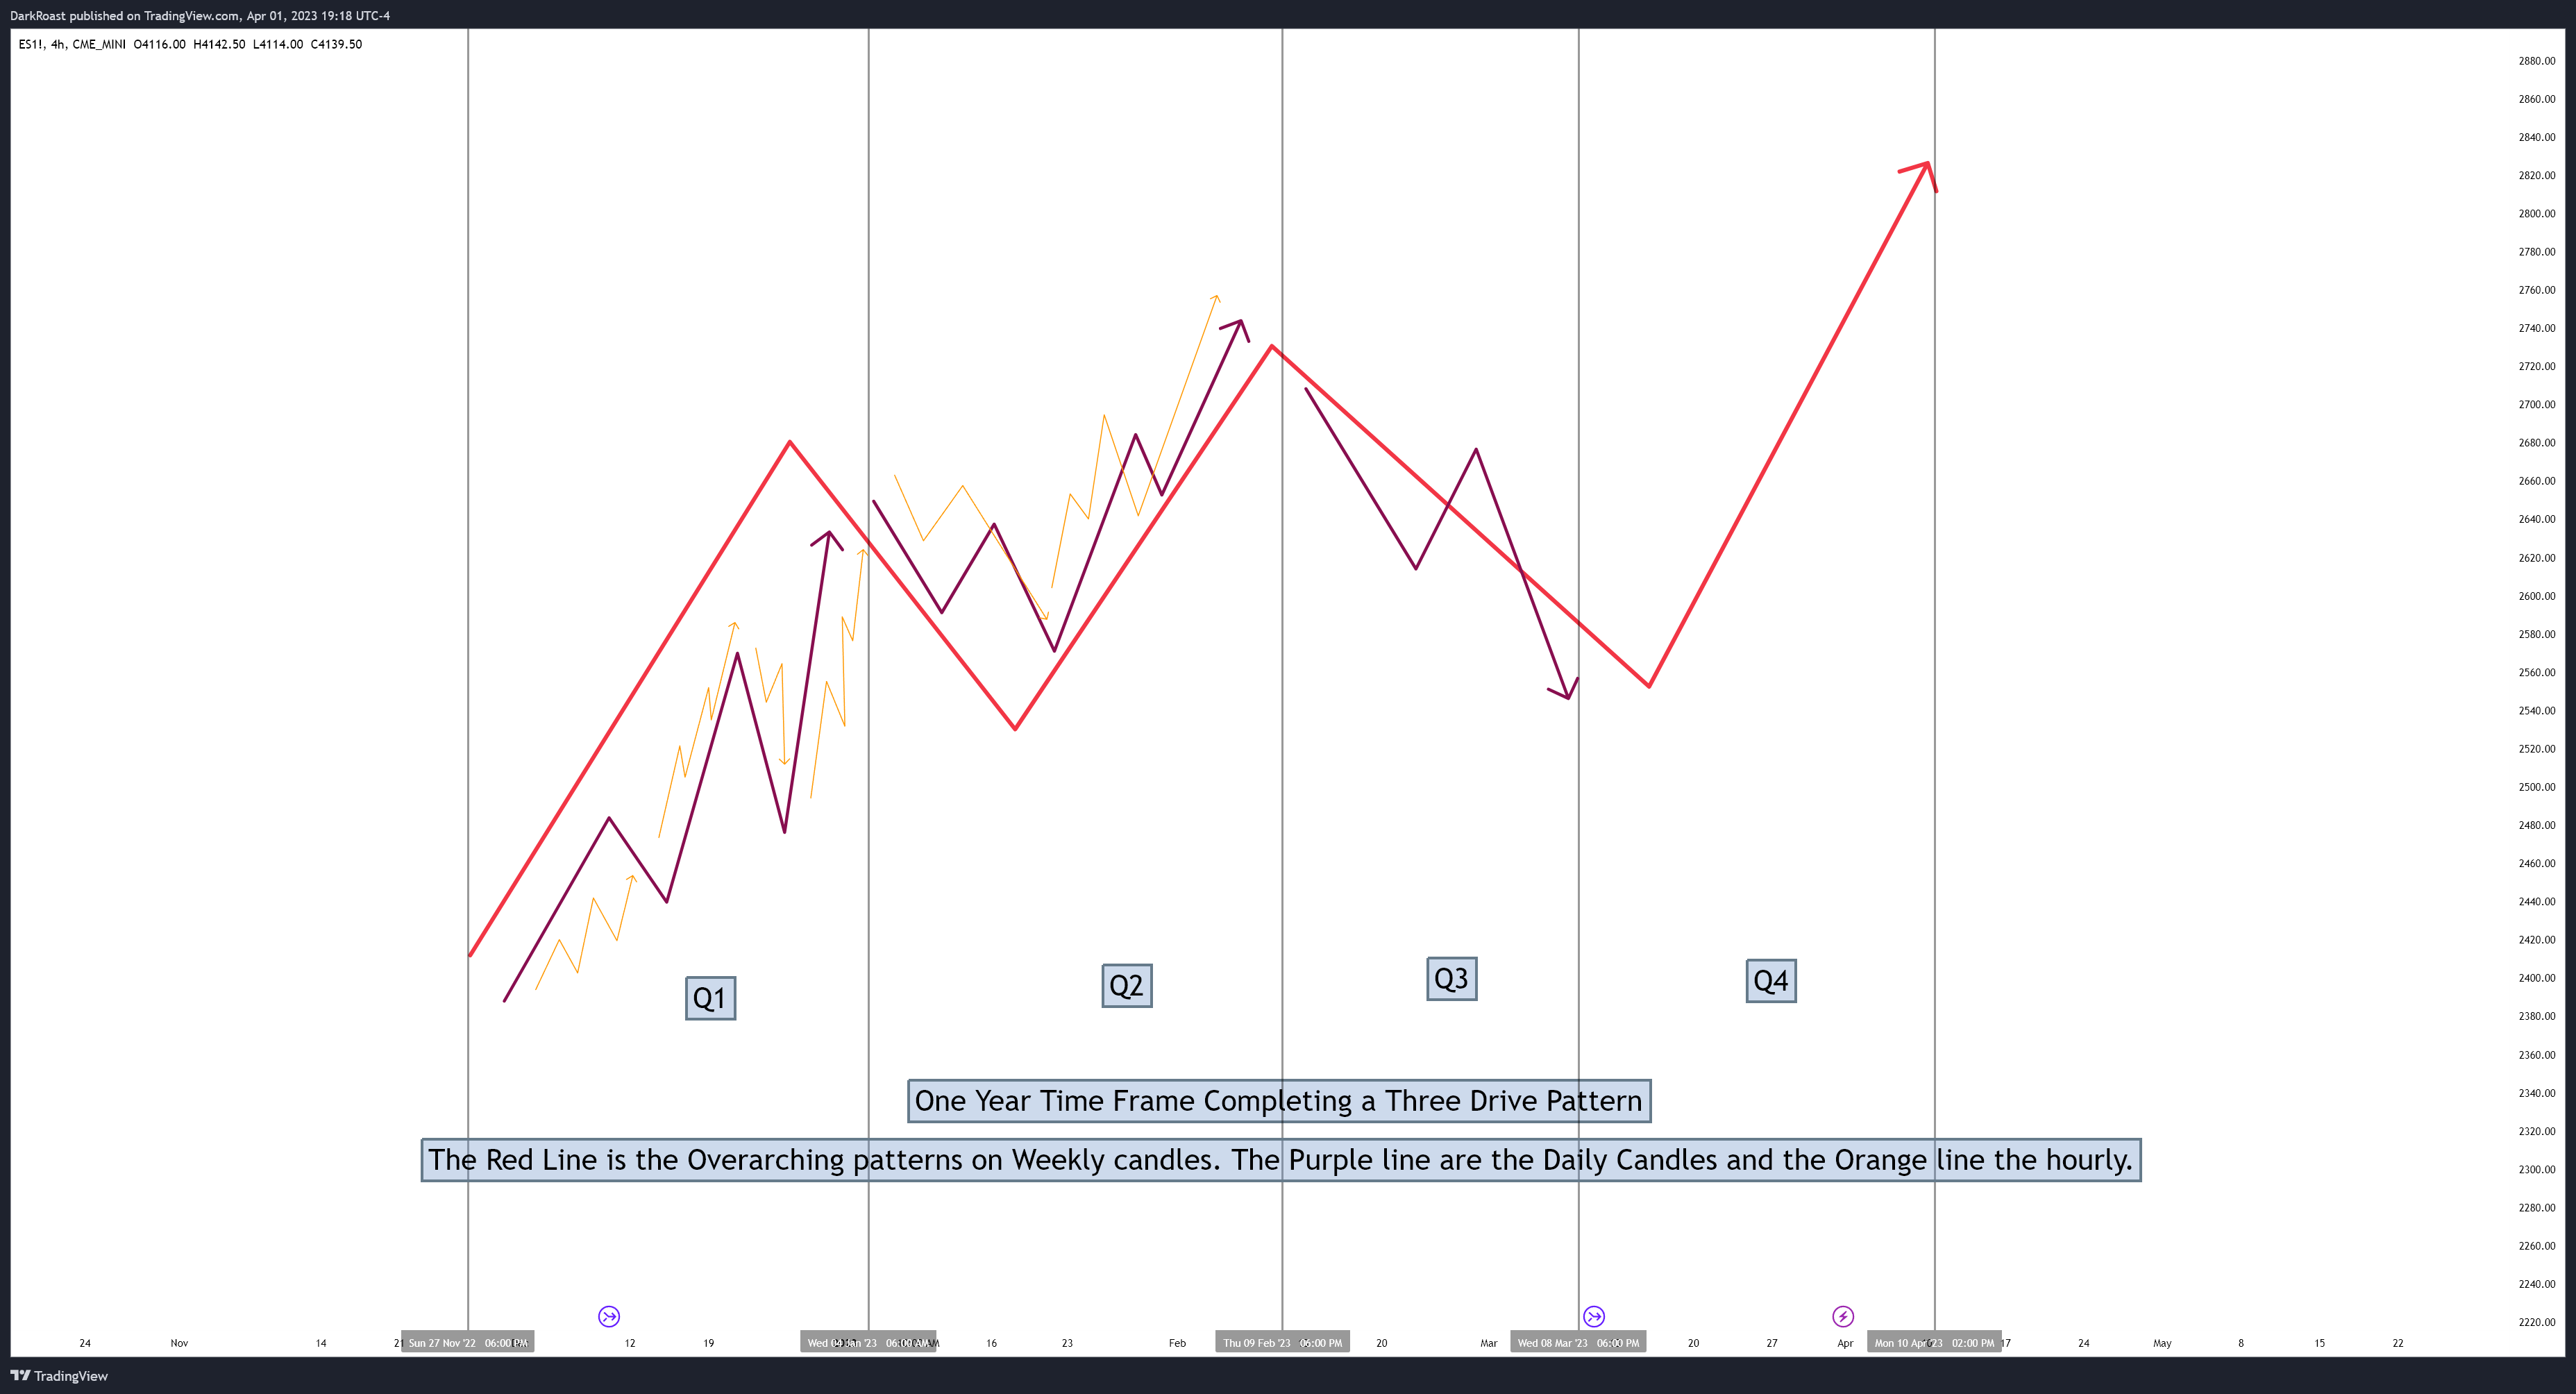
The example above is meant to represent one year. The red line represents weekly candles in a market that is trending up. Someone swinging their 401k may want to reposition once per quarter selling the peaks and buying the pullbacks. This is the highest time frame. Meanwhile the exact same pattern can de observed in smaller time frame candles. In this case the purple line is meant to represent daily candles. An intraday trader will want to be aware of the higher time frame daily bias even though the market is capable of deep pullbacks in uptrends. Finally the orange is hourly candles. It is patterns within patterns and every pattern has a percentage likelihood of completing based on back testing.
So how does that help with the current situation? As mentioned there are a number of patterns and measured moves and all are associated with a percentage likelihood of completing based on back testing the same pattern through hundred years of data on every time frame. A pattern can certainly break but the idea is that if through back testing a pattern is 78% likely to complete then it is a bet you should always take with appropriate risk management.
So lets jump to a higher time frame bias:
When the market sweeps February highs this isn’t the main target. The pullback tells us if we push higher or not. If the pullback opts to hold a higher low then on the highest time frame weekly candles it’s the first drive up (similar to the red line in the image above). The test of strength of the first drive up is holding a back test of around 60% retracement. Here is what that looks like:
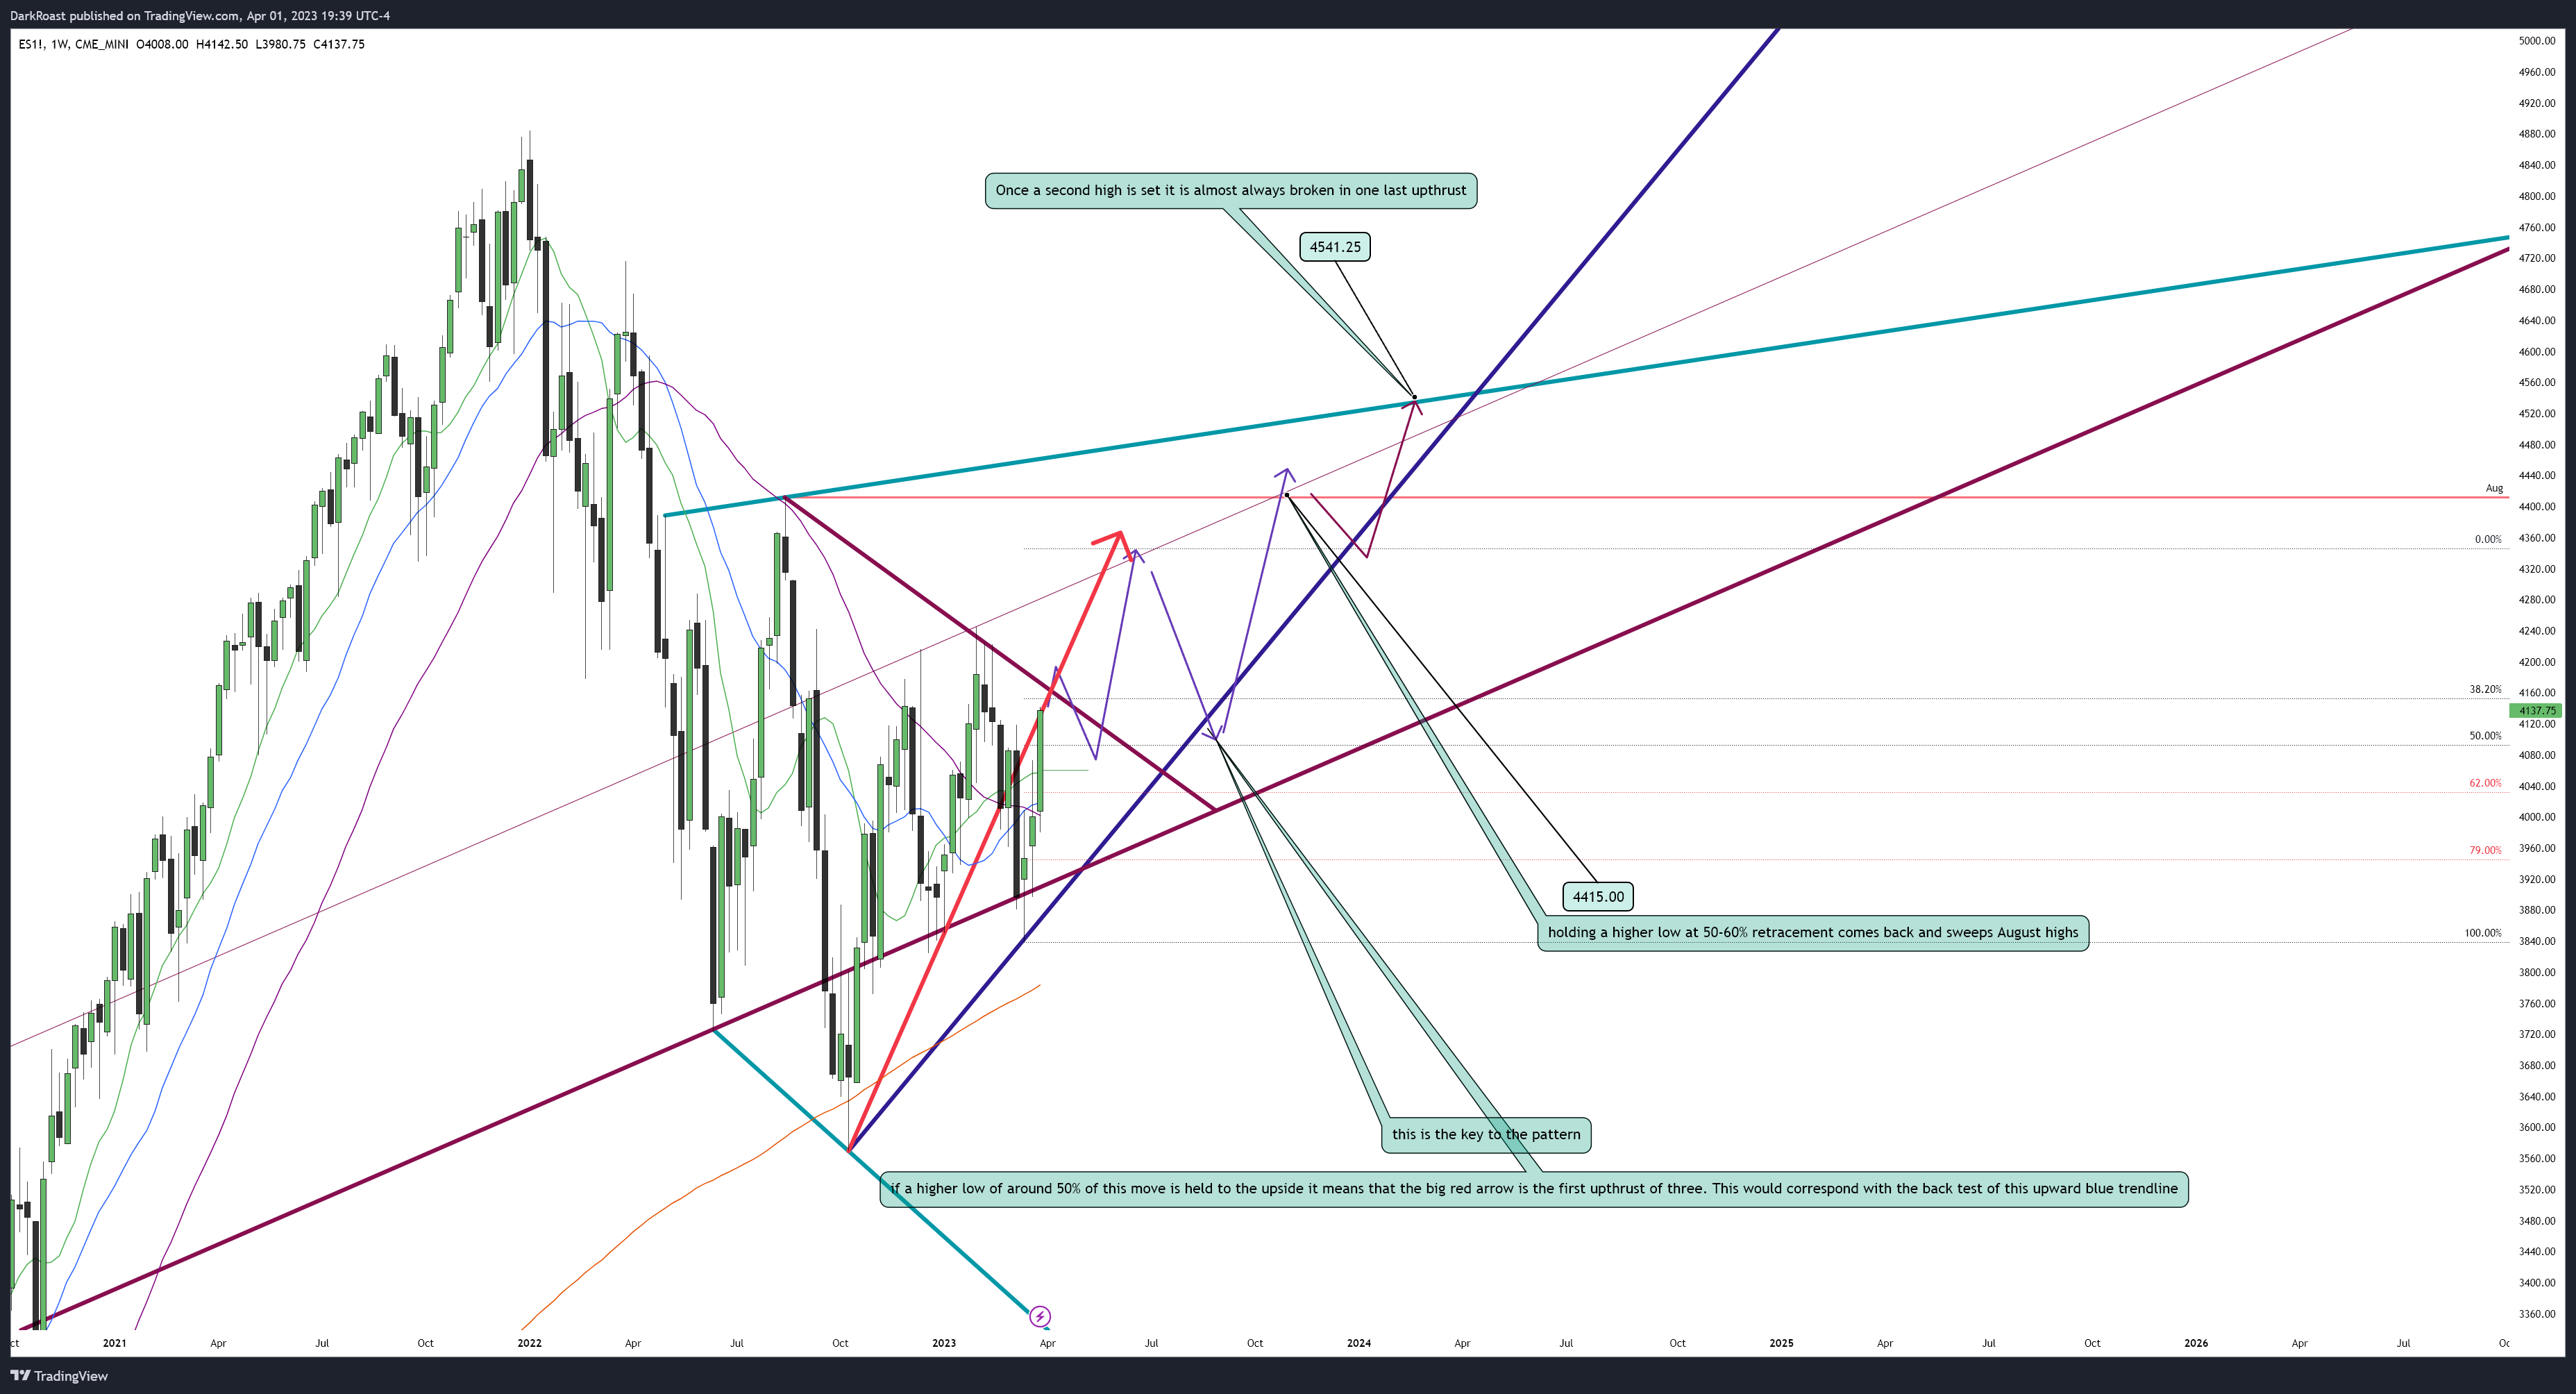
The reason for the schematic to start this explanation is two fold. First it is to illustrate the large red arrow is one move despite the choppy price action (similar to the drawing above) and second because once the back test is held with a higher low it becomes a new high time frame bias and will dictate all intraday decisions for the remainder of the year until the bias plays out or fails. There are two factors that are uncontrollable: if a pattern breaks (despite being back tested as a high %) and how long moves take to occur (when chop starts and stops).
As always high time frame bias will be incorporated into the smallest time frames for those interested in the intraday trade.
beautifully explained, i read before but never went into so much in depth. this should help a lot on intraday tradings