What this letter is: A Daily visual plan that I use to trade /ES futures
What this letter isn’t: An alert service.
EE’s /ES is a reader-supported publication. To receive new posts and support my work, consider becoming a free or paid subscriber.
No writing here is influenced by market fundamentals.
The focus of this stack will always be efficient trading. A simple daily letter outlining short term bull and bear scenarios coupled with a bias displayed visually on easy to read charts. Price action examples are explained and annotated when they’re relevant to the current day.
Levels given take into account channels, volume profile points of control, key zones acting as either magnets or potential squeeze targets.
Discord Link:
DM me once in discord if you’re a paid subscriber to add permissions to the channels for intraday updates and swing tickers.
Twitter Link:
Notes on Trades:
IMPORTANT - Execution is as important if not more so than levels. Please read my pinned guides to understand the concepts of reclaims, back tests, entries, exits and stop losses for help with execution.
There is no perfect play, only optimization of risk to reward using probabilities, market mechanics and strict rules established through back testing.
Targets don’t predict pullbacks nor do supports predict bounces. They’re simply points of interest to pay closer attention to price action. If a target is hit it doesn’t mean price will instantly pull back, it just means the probability becomes higher.
When bullish on /ES all supports are stronger in liquid individual tickers and dips are buyable. In contrast when bearish on ES resistances are stronger and pops are shortable. Having an accurate bias is everything as playing individual tickers is often just a proxy for playing the index itself.
How to Follow a Plan:
Every day an overall roadmap and a bear/bull scenario are given. The bear/bull scenario are the highest probability setups I see at the time of writing - not a prophecy as to whether they will occur.
These plans are based on recognizing similar scenarios/setups over my past experiences trading. To execute a plan it’s a traders job to identify which scenario is likely playing out based on how price is interacting with the levels outlined in the plan. After that trade management sees profit taking at resistance and trailing a stop loss for runners.
Trade plans aren’t set in stone. They need to be confirmed in real time by the various mechanisms to move price ie failed breakdowns, breakouts, back tests, support/resist flips, sweeps etc. All of these concepts are outlined with examples in the articles pinned to the top of the Substack.
Lastly there is a certain cadence to a trading day. The key times to trade are 2:00 AM, 7:30-10:30 AM and from 3:30 to close (market time). These represent the London session open, the cross over between New York open and London close and the MOC at end of market session. These all provide “volatility windows” for price to make a move. Typically price follows a setup during one of these windows which we intend to capture. Then price spends the next few hours (or days) chopping the various levels to confirm the move that has just been made. This letter does not focus on the scalping strategies necessary to trade intraday chop but this is a common time when traders end up giving profits back from the clean move already captured.
Daily Recap:
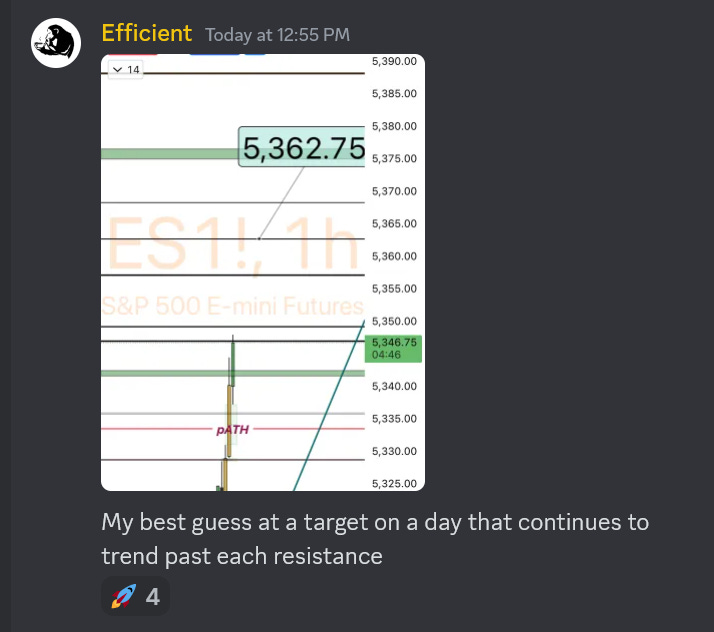
Today didn’t stray too far from the supposed bull case. Price broke out - hit 28 and had a 20 point pullback
Price then reclaimed:
We then closed right on 62 with a bit more in the tank AH. The video goes into more detail on upcoming expectations.
Full Recap:
Keep reading with a 7-day free trial
Subscribe to EE’s /ES to keep reading this post and get 7 days of free access to the full post archives.


